

Modern applications generate an astonishing amount of information.
Every user login, API request, database query, payment transaction, security event, and application error can produce one or more log entries. While these logs are invaluable for troubleshooting and monitoring, collecting them efficiently becomes a challenge as applications grow.
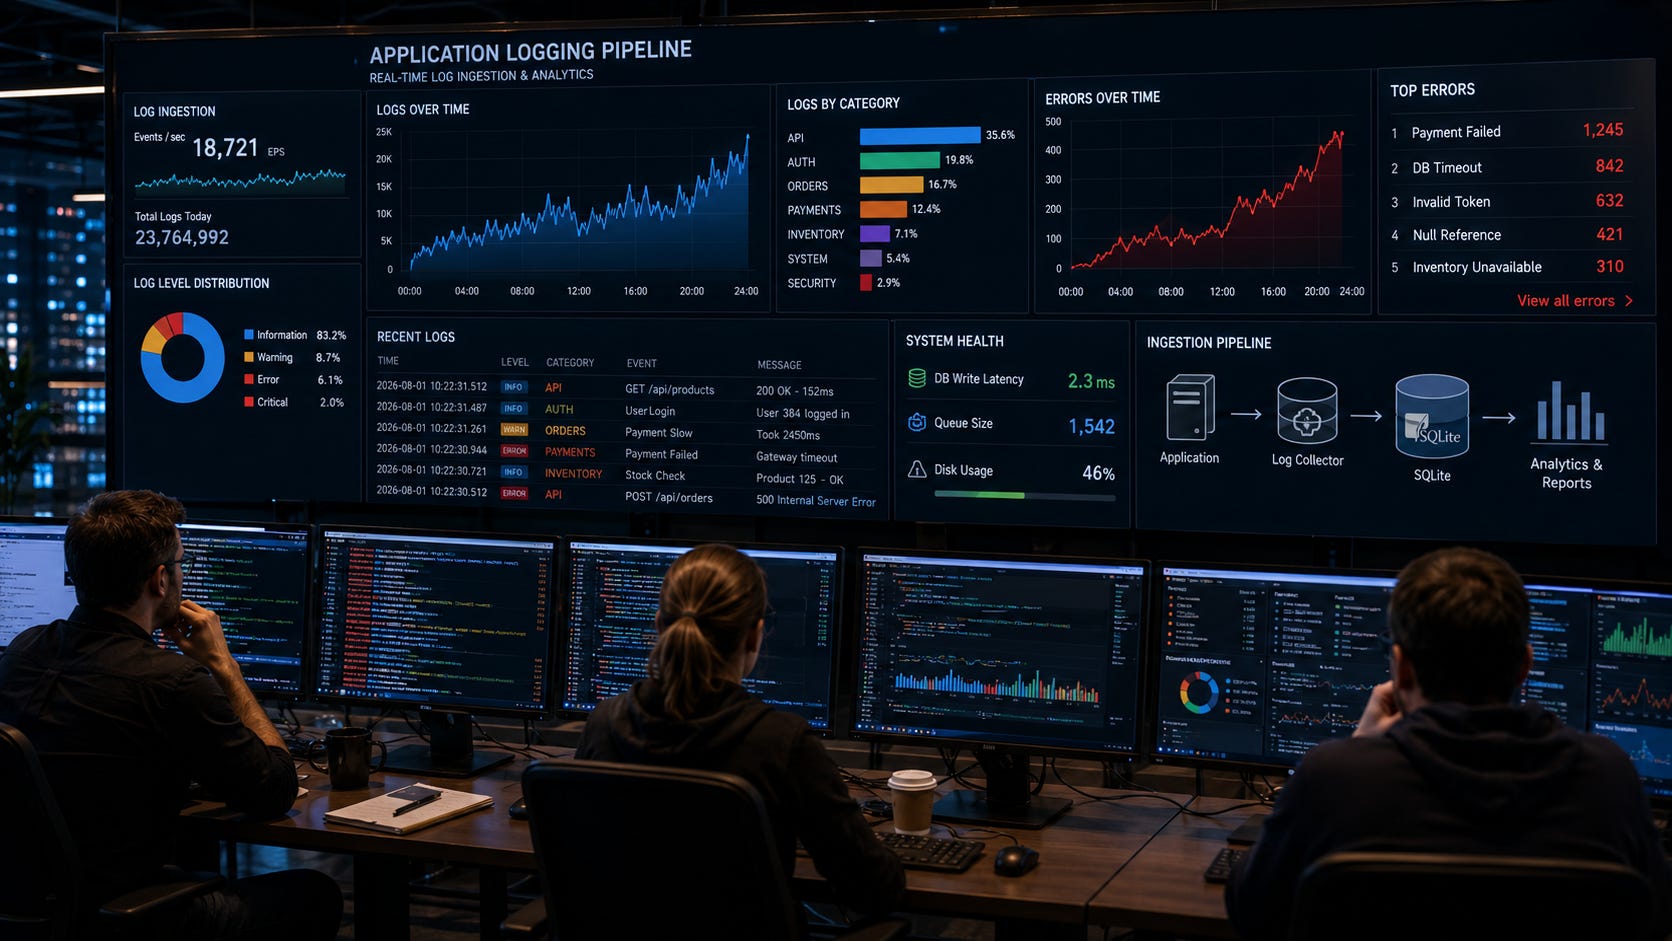
Imagine an online store serving thousands of customers every hour. Every page view, search, checkout, payment, and shipment generates structured information that developers may need later. If logging becomes slow, the application itself slows down. If logging is unreliable, valuable diagnostic information may be lost.
Many organizations use dedicated logging platforms for massive distributed systems. However, for desktop software, embedded systems, mobile applications, edge computing, IoT gateways, and many server-side applications, SQLite provides an excellent foundation for building a fast, reliable logging pipeline.
Its lightweight architecture, excellent write performance, transactional guarantees, and support for structured queries make it an ideal choice for storing and analyzing high volumes of application logs.
In this article, we’ll build a production-style logging pipeline powered entirely by SQLite. Along the way, we’ll explore schema design, structured logging, batch inserts, performance tuning, retention strategies, and efficient reporting.
Why SQLite Is an Excellent Logging Database
Logging workloads are different from traditional business applications.
Most logging systems perform:
Thousands of inserts
Very few updates
Occasional deletes
Frequent searches
SQLite performs exceptionally well under these conditions.
Benefits include:
Fast sequential writes
ACID transactions
Minimal deployment complexity
Offline operation
Easy backup
Powerful SQL querying
Instead of managing separate logging infrastructure, many applications can simply log directly into SQLite.
Building Our Logging Pipeline
We’ll build a logging system for an e-commerce application.
The application records:
User logins
Product searches
Shopping cart activity
Orders
Payment events
API requests
Exceptions
Every event becomes a structured log entry.
Designing the Log Table
Rather than storing plain text messages, we’ll create structured logs.
CREATE TABLE ApplicationLogs
(
    LogID INTEGER PRIMARY KEY,
    Timestamp TEXT NOT NULL,
    Level TEXT NOT NULL,
    Category TEXT NOT NULL,
    EventName TEXT NOT NULL,
    UserID INTEGER,
    Message TEXT,
    DurationMs INTEGER,
    Metadata TEXT
);
Each column has a clear purpose.
Column                    Purpose
Timestamp                 When the event occurred
Level                     Information, Warning, Error
Category                  Authentication, Orders, Payments
EventName                 Specific event
UserID                    Associated user
Message                   Human-readable description
DurationMs                Performance measurement
Metadata                  Additional structured information
This design makes searching and reporting significantly easier than parsing text files.
Structured Logs vs Plain Text Logs
Consider a traditional log file.
2026-08-01 Payment FailedIt contains information, but computers cannot easily analyze it.
Structured logging stores each piece separately.
Timestamp:
2026-08-01 10:22

Category:
Payment

Level:
Error

User:
384

Duration:
245 ms
SQLite can now answer questions such as:
Which users experience the most errors?
Which API is slowest?
How many payment failures occurred today?
without parsing text.
Writing Logs Efficiently
A simple insert looks like this.
INSERT INTO ApplicationLogs
(
    Timestamp,
    Level,
    Category,
    EventName,
    UserID,
    Message,
    DurationMs
)
VALUES
(
    datetime('now'),
    'Information',
    'Orders',
    'OrderCreated',
    125,
    'Order completed successfully',
    83
);
For occasional events this works well.
High-volume systems require a better approach.
Batch Inserts
Suppose an application generates 5,000 log events.
Instead of:
Insert

Commit

Insert

Commit

Insert

Commit
Group them into one transaction.
BEGIN TRANSACTION;

-- Multiple INSERT statements

COMMIT;
SQLite performs dramatically fewer disk operations, allowing thousands of log entries to be written much faster.
Batching is one of the easiest ways to increase ingestion performance.
Using WAL Mode
Write-Ahead Logging (WAL) is particularly useful for logging systems.
Enable it with:
PRAGMA journal_mode = WAL;Now:
Writers continue inserting logs.
Readers can query existing logs simultaneously.
This prevents reporting queries from blocking incoming log events.
If you’ve read our earlier article on Write-Ahead Logging Internals in SQLite, you’ve already seen how WAL improves concurrency by separating incoming writes from the main database file.
Index Only What You Search
Indexes improve read performance, but every additional index slows inserts.
A logging database should index only frequently searched columns.
CREATE INDEX idx_logs_timestamp
ON ApplicationLogs(Timestamp);

CREATE INDEX idx_logs_level
ON ApplicationLogs(Level);

CREATE INDEX idx_logs_category
ON ApplicationLogs(Category);
Avoid indexing every column.
Every insert must update every index.
Too many indexes reduce logging throughput.
Finding Recent Errors
A common diagnostic query looks like this.
SELECT
    Timestamp,
    EventName,
    Message
FROM ApplicationLogs
WHERE Level = 'Error'
ORDER BY Timestamp DESC
LIMIT 100;
This instantly returns the newest errors.
Developers can begin troubleshooting immediately.
Measuring API Performance
Suppose every API request records its execution time.
Finding the slowest endpoints becomes easy.
SELECT
    EventName,
    AVG(DurationMs) AS AverageTime
FROM ApplicationLogs
GROUP BY EventName
ORDER BY AverageTime DESC;
Example output:
| Endpoint | Average Time |
| -------- | -----------: |
| Checkout |       612 ms |
| Search   |       248 ms |
| Login    |        93 ms |
This highlights optimization opportunities.
Requests Per Minute
Operational dashboards often display request volume.
SQLite can calculate this directly.
SELECT
    strftime('%Y-%m-%d %H:%M', Timestamp) AS Minute,
    COUNT(*) AS Requests
FROM ApplicationLogs
GROUP BY Minute
ORDER BY Minute;
The result can feed line charts showing application traffic throughout the day.
Logical Log Partitioning
SQLite doesn’t support native table partitioning, but applications can achieve a similar result logically.
For example:
logs_2026_08.db

logs_2026_09.db

logs_2026_10.db
Each month has its own database.
Benefits include:
Smaller database files
Faster backups
Easier archival
Simpler retention management
Applications open only the databases they need.
Managing Log Retention
Logs should not grow forever.
A common policy keeps:
30 days of detailed logs
12 months of summaries
Older logs archived elsewhere
Deleting old data is straightforward.
DELETE
FROM ApplicationLogs
WHERE Timestamp < datetime('now','-30 days');
Running this periodically keeps the database compact.
Archiving Before Deletion
Some applications export logs before removing them.
Example workflow:
SQLite Logs
      ↓
Export
      ↓
Compressed Archive
      ↓
Delete Old Records
This preserves historical information while maintaining fast local performance.
Monitoring Log Volume
Understanding logging activity helps detect problems.
Example query:
SELECT
    Level,
    COUNT(*)
FROM ApplicationLogs
GROUP BY Level;
Output:
Level          Count
Information    820,451
Warning        4,210
Error          381
Sudden increases in errors become immediately visible.
Building a Reporting Pipeline
Logs become much more valuable when transformed into reports.
A simple reporting workflow looks like this.
Application Events
        ↓
SQLite Log Database
        ↓
Aggregation Queries
        ↓
Summary Tables
        ↓
Dashboards
        ↓
Operational Insights
The same SQLite database powers both ingestion and reporting.
Common Performance Mistakes
Many logging systems become slow because they:
Commit every insert individually.
Create unnecessary indexes.
Store unstructured text only.
Never archive old logs.
Run expensive reports against the entire history.
Keep millions of obsolete records.
Avoiding these mistakes dramatically improves long-term performance.
Best Practices
When building a high-volume logging pipeline:
Use structured log records.
Batch inserts inside transactions.
Enable WAL mode.
Index only frequently searched columns.
Archive old logs regularly.
Monitor ingestion rates.
Build summary reports for dashboards.
Separate operational queries from historical reporting whenever possible.
These practices allow SQLite to comfortably handle large logging workloads.
Closing Thoughts
Every production application depends on reliable logging.
Without logs, diagnosing failures, measuring performance, and understanding user behavior becomes almost impossible.
SQLite provides an excellent foundation for embedded logging systems by combining fast writes, transactional reliability, structured querying, and minimal operational complexity. With thoughtful schema design, batch inserts, WAL mode, efficient indexing, and sensible retention policies, a single SQLite database can ingest and analyze millions of structured log events while remaining responsive.
Whether you’re building a desktop application, an IoT gateway, a retail point-of-sale system, or a backend service, SQLite can serve as both your operational log store and your reporting engine, delivering valuable insights without introducing additional infrastructure.
Subscribe Now
Build Production-Ready Systems with SQLite
Enjoyed this deep dive into high-volume logging? Subscribe to SQLite Forum for practical tutorials, real-world projects, and in-depth guides that help you get more from SQLite. Every week, we explore techniques you can apply immediately, from database internals and performance tuning to offline-first architectures, analytics, and production-ready application design.
@Jenny Muralidharan thank you so much for those articles, do you have any email or social that I can contact you for a roadblock In SQLite that I have fallen upon?
Once again a fantastic article from the forum and Jenny.