

Factories, farms, warehouses, vehicles, retail stores, energy systems, and smart buildings increasingly depend on small computers operating far away from traditional data centers.
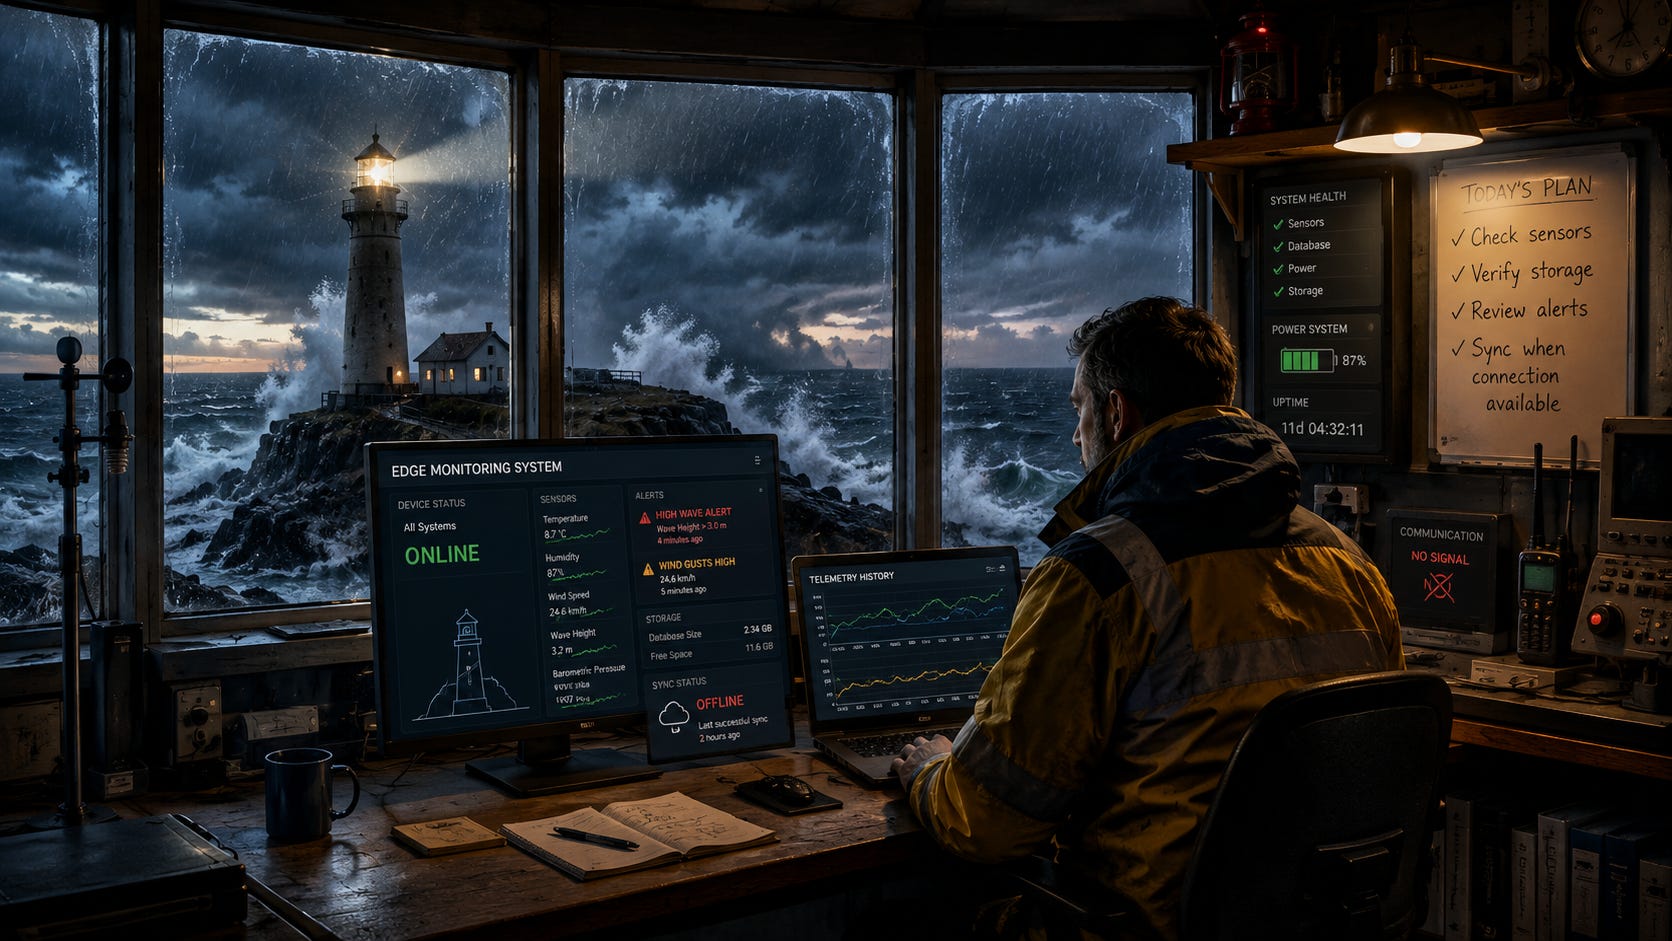
These edge devices collect information from the physical world. A device might monitor temperature inside a refrigerated warehouse, vibration on a factory motor, power consumption in a building, or environmental conditions on a farm.
But collecting measurements is only part of the job.
What happens when the internet connection disappears?
What if a sensor suddenly reports dangerous values?
How do we preserve thousands of measurements without constantly sending everything to the cloud?
This is where SQLite can become an important part of an edge monitoring system.
Instead of treating an edge device as a simple sensor that forwards everything elsewhere, we can give it its own local monitoring pipeline. SQLite stores telemetry, tracks device health, supports local analysis, detects abnormal conditions, manages retention, and preserves information until external systems are available again.
In this guide, we’ll build such a system from the ground up.
What Does an Edge Monitoring System Do?
Imagine a refrigeration unit inside a food warehouse.
Several sensors continuously measure:
Temperature
Humidity
Compressor vibration
Power consumption
Door status
Every few seconds, new measurements arrive.
A traditional cloud-first design might immediately send each measurement to a remote server.
Our edge-first design looks different:
Sensors
   ↓
Edge Device
   ↓
SQLite
   ↓
Local Analysis
   ↓
Alerts / Summaries
   ↓
Cloud When Available
The edge device remains useful even when the network does not.
That changes SQLite from simple storage into part of the monitoring infrastructure.
Building Our Monitoring System
We’ll build a simplified monitoring system for industrial refrigeration equipment.
Each monitored unit has several sensors.
Let’s start by recording the devices.
CREATE TABLE Devices (
    DeviceID TEXT PRIMARY KEY,
    DeviceName TEXT NOT NULL,
    Location TEXT,
    DeviceType TEXT NOT NULL,
    LastSeenAt TEXT,
    Status TEXT NOT NULL DEFAULT 'unknown'
);
Example devices might include:
coldroom-01
freezer-02
compressor-07
Now we need somewhere to store their measurements.
Designing the Telemetry Table
Telemetry is usually an append-heavy workload.
Measurements arrive continuously, while historical records rarely need modification.
A straightforward schema is:
CREATE TABLE Telemetry (
    TelemetryID INTEGER PRIMARY KEY,
    DeviceID TEXT NOT NULL,
    Metric TEXT NOT NULL,
    Value REAL NOT NULL,
    RecordedAt TEXT NOT NULL,
    FOREIGN KEY (DeviceID)
        REFERENCES Devices(DeviceID)
);
A temperature measurement might look like:
DeviceID: coldroom-01
Metric: temperature
Value: 3.8
RecordedAt: 2026-08-22 09:15:03
Five seconds later:
coldroom-01
temperature
3.9
2026-08-22 09:15:08
Over a day, even a small number of sensors can generate thousands of rows.
That makes write efficiency important.
Writing Telemetry Efficiently
Writing every measurement as its own committed transaction creates unnecessary storage overhead.
Instead, collect small batches.
For example:
BEGIN TRANSACTION;

INSERT INTO Telemetry
(DeviceID, Metric, Value, RecordedAt)
VALUES
('coldroom-01', 'temperature', 3.8, CURRENT_TIMESTAMP);

INSERT INTO Telemetry
(DeviceID, Metric, Value, RecordedAt)
VALUES
('coldroom-01', 'humidity', 61.2, CURRENT_TIMESTAMP);

INSERT INTO Telemetry
(DeviceID, Metric, Value, RecordedAt)
VALUES
('compressor-07', 'vibration', 1.7, CURRENT_TIMESTAMP);

COMMIT;
Batching allows SQLite to commit several measurements together.
For high-frequency sensors, the application might maintain a short in-memory queue and flush measurements every few seconds or when the queue reaches a defined size.
The correct batch size depends on how much recent data the application can afford to lose if the device suddenly loses power.
Performance and durability must be balanced deliberately.
Using WAL Mode
Monitoring systems frequently need to write new measurements while another process reads existing data.
For example:
Sensor Collector → Writing

Dashboard → Reading

Alert Engine → Reading

Sync Worker → Reading
Write-Ahead Logging is well suited to this pattern.
PRAGMA journal_mode = WAL;With WAL enabled, readers generally do not block the writer, and the writer generally does not block readers.
This means the monitoring dashboard can query recent telemetry while new measurements continue arriving.
WAL does not make SQLite a multi-writer server database. SQLite still serializes writes.
For an edge device with a controlled local ingestion pipeline, however, that model is often exactly what we need.
Finding the Latest Device Reading
A local dashboard may need the newest temperature measurement.
SELECT
    Value,
    RecordedAt
FROM Telemetry
WHERE DeviceID = 'coldroom-01'
  AND Metric = 'temperature'
ORDER BY RecordedAt DESC
LIMIT 1;
Because this query may run frequently, we should support it with an appropriate index.
CREATE INDEX idx_telemetry_device_metric_time
ON Telemetry(DeviceID, Metric, RecordedAt DESC);
Now SQLite can locate recent measurements without scanning the entire telemetry history.
Monitoring Device Health
Telemetry values tell us about the environment.
But we also need to know whether the monitoring device itself is healthy.
Suppose every device sends a heartbeat periodically.
When a heartbeat arrives:
UPDATE Devices
SET
    LastSeenAt = CURRENT_TIMESTAMP,
    Status = 'online'
WHERE DeviceID = 'coldroom-01';
The monitoring process can then look for devices that have stopped communicating.
SELECT
    DeviceID,
    DeviceName,
    LastSeenAt
FROM Devices
WHERE LastSeenAt < datetime('now', '-5 minutes');
A device appearing in this query may be:
Offline
Disconnected
Frozen
Out of power
Experiencing a sensor or software failure
This is important because no data can itself be meaningful data.
Detecting Dangerous Conditions Locally
Now imagine the cold room temperature begins rising.
Normal:
3.8°C
4.0°C
4.2°C
Then:
6.5°C
8.1°C
10.4°C
Waiting for a cloud server to detect the problem introduces unnecessary dependency on the network.
The edge device can detect it locally.
Let’s define monitoring thresholds.
CREATE TABLE MonitoringRules (
    RuleID INTEGER PRIMARY KEY,
    DeviceType TEXT NOT NULL,
    Metric TEXT NOT NULL,
    MinimumValue REAL,
    MaximumValue REAL,
    Severity TEXT NOT NULL
);
For example:
INSERT INTO MonitoringRules
(
    DeviceType,
    Metric,
    MinimumValue,
    MaximumValue,
    Severity
)
VALUES
(
    'cold_storage',
    'temperature',
    0,
    5,
    'critical'
);
Now readings can be checked immediately.
If:
Temperature = 8.1°Cand:
Maximum = 5°Cthe device can create an alert without contacting the cloud.
Recording Alerts
Let’s store detected problems separately.
CREATE TABLE Alerts (
    AlertID INTEGER PRIMARY KEY,
    DeviceID TEXT NOT NULL,
    Metric TEXT NOT NULL,
    ObservedValue REAL,
    Severity TEXT NOT NULL,
    CreatedAt TEXT NOT NULL DEFAULT CURRENT_TIMESTAMP,
    ResolvedAt TEXT,
    Status TEXT NOT NULL DEFAULT 'open'
);
When a dangerous reading appears:
INSERT INTO Alerts
(
    DeviceID,
    Metric,
    ObservedValue,
    Severity
)
VALUES
(
    'coldroom-01',
    'temperature',
    8.1,
    'critical'
);
A local display can immediately show the alert.
Depending on the equipment, the edge application might also activate a warning light, sound an alarm, or notify another local controller.
The important point is that basic safety monitoring does not depend on a remote database connection.
Avoiding Alert Floods
Suppose temperature remains too high for ten minutes.
If measurements arrive every five seconds, we don’t want 120 identical alerts.
Instead, check whether an unresolved alert already exists.
SELECT AlertID
FROM Alerts
WHERE DeviceID = ?
  AND Metric = ?
  AND Status = 'open'
LIMIT 1;
If one exists, update it or leave it active rather than creating another.
When temperature returns to normal:
UPDATE Alerts
SET
    Status = 'resolved',
    ResolvedAt = CURRENT_TIMESTAMP
WHERE AlertID = ?;
This turns raw threshold violations into meaningful incidents.
Looking Beyond Single Measurements
One unusual measurement does not always mean something is wrong.
Imagine vibration readings:
1.2
1.3
7.9
1.2
1.4
The 7.9 reading may simply be noise.
But:
1.2
1.8
2.5
3.4
4.6
5.9
suggests a trend.
SQLite can analyze a recent window of measurements.
SELECT
    AVG(Value) AS AverageVibration,
    MIN(Value) AS MinimumVibration,
    MAX(Value) AS MaximumVibration
FROM Telemetry
WHERE DeviceID = 'compressor-07'
  AND Metric = 'vibration'
  AND RecordedAt >= datetime('now', '-10 minutes');
This allows the edge device to make decisions using recent behaviour rather than reacting to every isolated measurement.
Building Local Summaries
Raw telemetry grows quickly.
A sensor recording every five seconds produces:
12 readings per minute
720 per hour
17,280 per day
Multiply that across dozens of metrics and devices, and storage usage begins to matter.
But we may not need every historical reading forever.
One solution is aggregation.
Create an hourly summary table:
CREATE TABLE HourlyTelemetrySummary (
    DeviceID TEXT NOT NULL,
    Metric TEXT NOT NULL,
    Hour TEXT NOT NULL,
    AverageValue REAL,
    MinimumValue REAL,
    MaximumValue REAL,
    SampleCount INTEGER,
    PRIMARY KEY (DeviceID, Metric, Hour)
);
Then aggregate older telemetry:
INSERT OR REPLACE INTO HourlyTelemetrySummary
SELECT
    DeviceID,
    Metric,
    strftime('%Y-%m-%d %H:00:00', RecordedAt),
    AVG(Value),
    MIN(Value),
    MAX(Value),
    COUNT(*)
FROM Telemetry
WHERE RecordedAt >= ?
  AND RecordedAt < ?
GROUP BY
    DeviceID,
    Metric,
    strftime('%Y-%m-%d %H:00:00', RecordedAt);
We retain useful historical information without preserving every raw measurement indefinitely.
Designing a Retention Policy
Edge devices have limited storage.
A monitoring database therefore needs a clear retention policy.
For example:
Raw telemetry        → 7 days
Hourly summaries     → 90 days
Daily summaries      → 2 years
Critical alerts      → Keep until archived
After successful aggregation or synchronization, old raw measurements can be removed.
DELETE FROM Telemetry
WHERE RecordedAt < datetime('now', '-7 days');
Do not simply assume deleting rows immediately shrinks the database file.
SQLite can reuse freed pages for future writes. If reclaiming file-system space is necessary, database maintenance should be planned separately rather than continuously running VACUUM on an active monitoring workload.
Monitoring Storage Before It Becomes a Problem
The monitoring system itself needs monitoring.
If the disk fills completely, telemetry collection may stop.
The application should track:
Database size
Free disk space
WAL size
Pending synchronization records
Oldest unsynchronized measurement
Insert failures
For example:
Disk Usage: 72%
Database: 1.8 GB
Pending Upload: 42 MB
Oldest Unsynced Data: 3 hours
Thresholds can warn operators before the device runs out of capacity.
Working Without the Internet
One of the strongest reasons to process telemetry at the edge is unreliable connectivity.
Consider an agricultural monitoring station located far from a city.
Connectivity may look like:
Online
Online
Offline
Offline
Offline
Online
Telemetry should continue during the entire period.
Sensors
   ↓
SQLite
   ↓
Stored Locally
When connectivity returns:
SQLite
   ↓
Sync Queue
   ↓
Remote API
The cloud receives the delayed information without creating a gap in the local monitoring history.
This is closely related to the offline-first synchronization architecture we built earlier in this series.
Tracking Synchronization State
We need to know which measurements have reached the server.
One simple design is to add synchronization state.
ALTER TABLE Telemetry
ADD COLUMN Synced INTEGER NOT NULL DEFAULT 0;
The synchronization worker retrieves a batch:
SELECT *
FROM Telemetry
WHERE Synced = 0
ORDER BY TelemetryID
LIMIT 500;
After the remote system confirms successful ingestion:
UPDATE Telemetry
SET Synced = 1
WHERE TelemetryID IN (...);
For a production implementation, acknowledgements and retries need careful design so that an interrupted request does not silently lose telemetry.
Idempotent server-side ingestion is particularly valuable here.
Why Batch Synchronization Matters
Sending one HTTP request per sensor reading would be wasteful.
Instead:
500 Measurements
       ↓
One Batch
       ↓
Remote Server
Batching reduces:
Network overhead
Connection setup
Battery consumption
API traffic
Synchronization time
This is especially valuable for cellular or satellite-connected edge systems.
Prioritizing Important Data
Not all telemetry has equal urgency.
Consider:
Normal temperature reading → Low urgency

Critical overheating alert → High urgency
If the device has limited connectivity, alerts should be transmitted before routine historical telemetry.
A synchronization queue might prioritize:
1. Critical alerts
2. Device health events
3. Recent telemetry
4. Historical telemetry
5. Summaries
SQLite makes these queues straightforward to query and manage locally.
Building a Local Dashboard
Because telemetry already lives in SQLite, the edge device can power its own dashboard.
For example:
Cold Room 01

Temperature       3.9°C
Humidity          62%
Door              Closed
Device            Online

Last Hour
Min Temperature   3.4°C
Max Temperature   4.3°C

Open Alerts       0
Cloud Sync        Connected
This dashboard remains available even if the internet connection disappears.
For technicians working directly beside industrial equipment, that can be far more useful than a cloud-only dashboard.
Performance Considerations
An edge monitoring database may perform several workloads simultaneously:
Telemetry Inserts
Alert Queries
Dashboard Queries
Aggregation
Synchronization
Retention Cleanup
A few principles help keep these workloads predictable.
Batch Writes
Group telemetry inserts into transactions rather than committing every row individually.
Use WAL
WAL mode allows monitoring queries to coexist more comfortably with continuous ingestion.
Index Carefully
Useful indexes may include:
CREATE INDEX idx_telemetry_sync
ON Telemetry(Synced, TelemetryID);
and our earlier:
CREATE INDEX idx_telemetry_device_metric_time
ON Telemetry(DeviceID, Metric, RecordedAt DESC);
Every index has a write cost, so don’t index fields simply because they exist.
Keep Transactions Short
A long-running transaction can interfere with WAL checkpoint progress and allow the WAL file to grow.
Reporting and synchronization queries should process manageable batches rather than holding database transactions open unnecessarily.
Handling Power Loss
Edge devices can lose power unexpectedly.
That makes durability particularly important.
SQLite transactions ensure incomplete writes do not leave committed database state half-finished.
However, durability is not just a database setting.
A production edge system should also consider:
Storage hardware quality
File-system behaviour
Power-loss characteristics
SQLite synchronous settings
Backup strategy
Recovery testing
Reducing durability settings for additional write speed may be appropriate for disposable telemetry in some systems, but dangerous in others.
If measurements matter, understand the trade-off before changing SQLite’s durability guarantees.
A Production Monitoring Architecture
Our complete system now looks like this:
Sensors
   ↓
Data Collector
   ↓
Validation
   ↓
SQLite Telemetry Store
   ↓
   ├── Local Alert Engine
   ├── Device Health Monitor
   ├── Local Dashboard
   ├── Aggregation Pipeline
   ├── Retention Worker
   └── Synchronization Queue
             ↓
        Network Available?
          ↙       ↘
        No         Yes
        ↓           ↓
     Keep Data    Cloud API
        Local
Notice that the remote server is no longer at the center of every operation.
The edge device can collect, analyze, alert, summarize, and display information independently.
The cloud becomes another destination for the data rather than a prerequisite for the system to function.
When SQLite Is a Good Fit
SQLite is particularly attractive for edge monitoring when:
One device owns its local database.
Telemetry is primarily append-oriented.
Internet connectivity may disappear.
Local queries and alerts are required.
Deployment needs to remain simple.
Storage resources are constrained.
A dedicated database server would add unnecessary complexity.
Examples include:
Industrial gateways
Agricultural monitoring stations
Smart buildings
Retail equipment
Vehicle systems
Environmental sensors
Energy monitoring
Medical and laboratory equipment
The exact architecture will depend on how much data is collected and how critical that data is.
When SQLite Is Not Enough
SQLite should not be forced into every monitoring problem.
A central platform collecting billions of measurements from millions of devices has very different requirements from an individual edge node.
At that scale, specialized time-series databases, distributed streaming platforms, or analytical systems may be more appropriate centrally.
But that does not remove SQLite from the architecture.
A common design can be:
Thousands of Edge Devices
        ↓
SQLite on Each Device
        ↓
Central Ingestion Platform
        ↓
Large-Scale Analytics System
SQLite handles local reliability.
The central platform handles global scale.
The two solve different problems.
Best Practices
When building an edge monitoring system with SQLite:
Validate incoming sensor measurements.
Batch high-frequency inserts.
Use WAL when concurrent local reads are required.
Keep write ownership simple.
Index according to real monitoring queries.
Detect missing device heartbeats.
Evaluate important alerts locally.
Avoid generating duplicate alerts.
Aggregate old telemetry before deleting it.
Define explicit data retention policies.
Monitor available storage.
Synchronize telemetry in batches.
Make remote ingestion safe to retry.
Prioritize critical events during limited connectivity.
Keep database transactions short.
Test recovery from network, process, storage, and power failures.
The goal is not merely to collect data.
It is to build a monitoring system that continues operating when conditions are imperfect.
Closing Thoughts
Edge computing changes an important assumption about application architecture.
Data does not always need to travel to a central server before it becomes useful.
A temperature sensor can detect a dangerous condition locally. A factory gateway can analyze equipment behaviour without waiting for the cloud. A remote monitoring station can preserve days of measurements while completely disconnected from the internet.
SQLite makes these architectures practical because it gives small devices a capable transactional database without requiring a separate database server.
With efficient telemetry ingestion, WAL-based concurrency, local alerting, aggregation, retention policies, health monitoring, and reliable synchronization, SQLite can become the durable local foundation of an edge monitoring platform.
The result is a system that does more than collect measurements.
It keeps watching, keeps recording, and keeps making useful decisions even when the rest of the network disappears.
Subscribe Now
Take SQLite Beyond the Data Center
SQLite can do much more than store application records. At the edge, it can collect telemetry, detect problems locally, preserve data through network outages, and keep critical systems operating independently.
Subscribe to SQLite Forum for practical tutorials, advanced SQLite techniques, and real-world architectures that explore how SQLite powers modern applications, from embedded systems and offline-first apps to analytics, monitoring, and production infrastructure.