

An IoT sensor rarely produces just one measurement.
A temperature sensor may report every few seconds. A smart electricity meter may continuously record power consumption. A factory machine may produce vibration, pressure, temperature, and speed readings throughout the day.
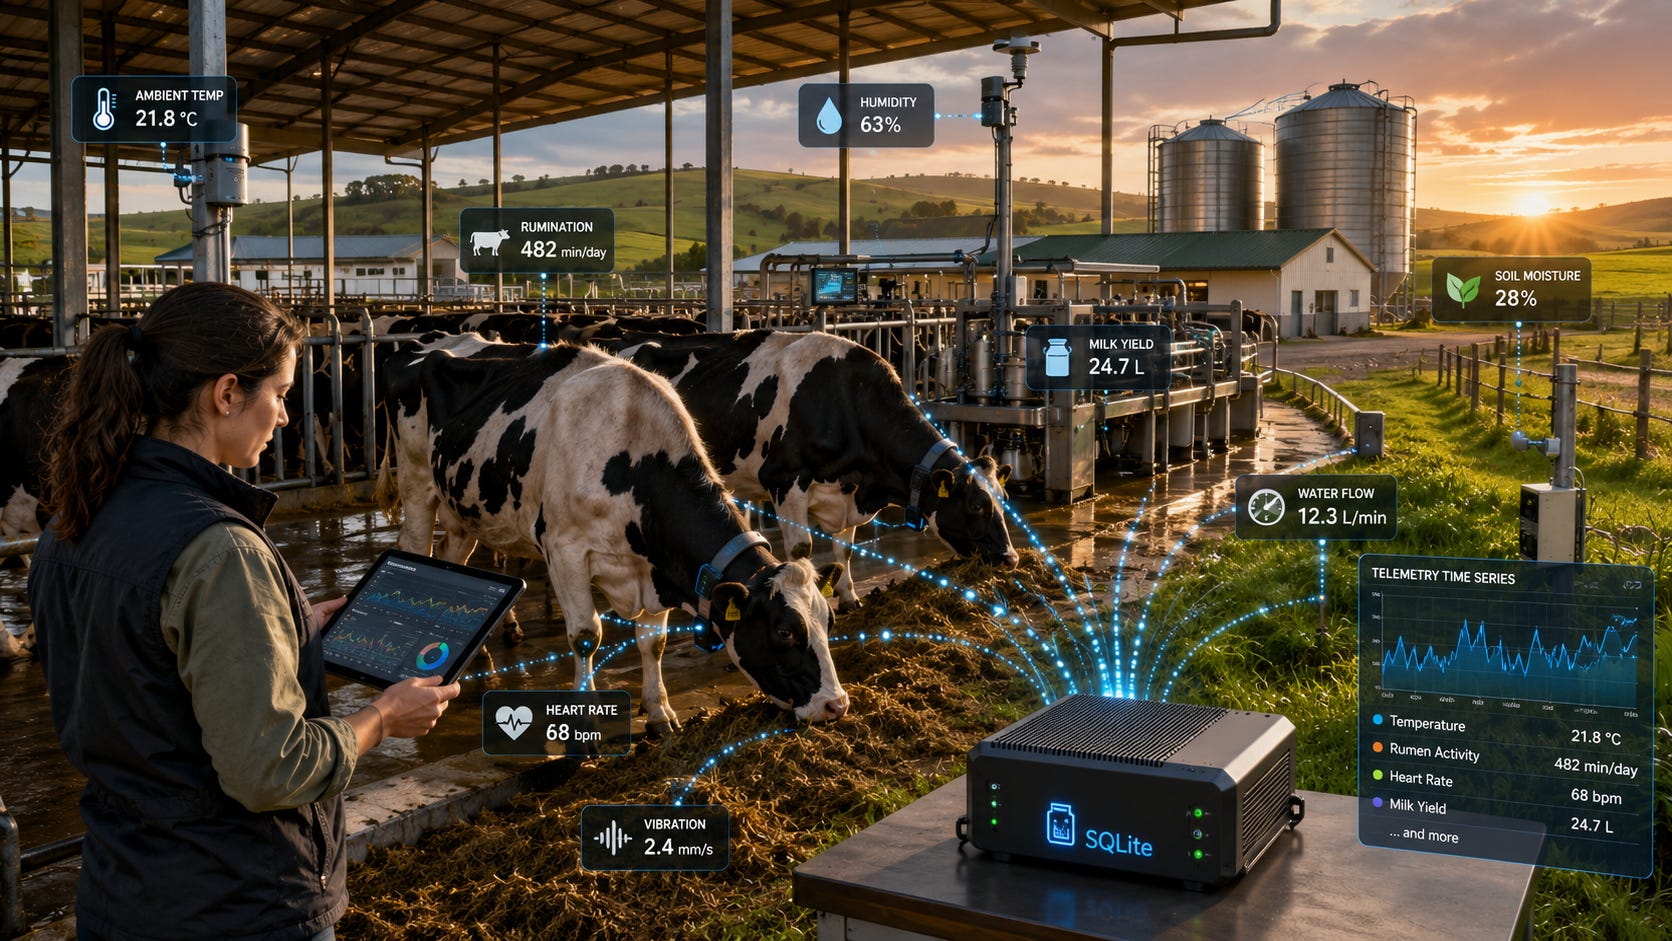
Multiply that by dozens or hundreds of sensors, and an IoT application quickly becomes a continuous stream of time-stamped data.
SQLite is particularly useful when these telemetry streams need to be stored directly on an IoT gateway, embedded computer, edge device, or offline system. It gives us reliable local storage and powerful SQL querying without requiring a separate database server.
But telemetry creates a different database workload from a typical business application.
We aren’t constantly updating customer records or deleting shopping-cart items. Instead, we’re repeatedly appending measurements such as:
10:30:00  Temperature  21.7
10:30:05  Temperature  21.8
10:30:10  Temperature  21.9
10:30:15  Temperature  22.1
That makes schema design, timestamp handling, indexes, ingestion speed, retention, and aggregation particularly important.
In this article, we’ll design a SQLite database specifically for IoT telemetry streams and build a practical time-series storage pipeline that remains efficient as millions of sensor readings accumulate.
From Edge Monitoring to Telemetry Storage
In our previous article, we looked at an entire edge monitoring system.
The architecture included:
Sensors
   ↓
Edge Device
   ↓
SQLite
   ↓
Alerts
Dashboards
Aggregation
Cloud Sync
This time, we’re going deeper into one critical part of that architecture:
the telemetry database itself.
We’ll concentrate on how sensor measurements should be represented, inserted, indexed, queried, summarized, and eventually removed.
Imagine we’re monitoring a manufacturing facility.
Machines contain sensors measuring:
Temperature
Pressure
Vibration
Rotational speed
Voltage
Current
Power consumption
Some report every minute.
Others report several times per second.
Our database needs to handle both efficiently.
Understanding Time-Series Data
Telemetry is a form of time-series data.
Each measurement has at least three important pieces of information:
What produced it?
What was measured?
When was it measured?
And, of course:
What was the value?A measurement might therefore look like:
Device: motor-17
Metric: vibration
Time:   2026-08-29 10:30:15
Value:  2.74
Five seconds later:
motor-17
vibration
2026-08-29 10:30:20
2.81
The database gradually builds a history of how that measurement changes over time.
Start by Separating Devices from Measurements
Avoid repeating descriptive device information in every telemetry row.
Instead, create a device table:
CREATE TABLE Devices (
    DeviceID INTEGER PRIMARY KEY,
    DeviceKey TEXT NOT NULL UNIQUE,
    DeviceName TEXT NOT NULL,
    DeviceType TEXT,
    Location TEXT
);
Example:
INSERT INTO Devices
(
    DeviceKey,
    DeviceName,
    DeviceType,
    Location
)
VALUES
(
    'motor-17',
    'Cooling Pump Motor 17',
    'industrial_motor',
    'Plant A'
);
The telemetry table can reference the compact integer DeviceID.
That becomes increasingly valuable when the table contains millions of rows.
Should Metrics Be Stored as Text?
Our simplest telemetry design could be:
CREATE TABLE Telemetry (
    TelemetryID INTEGER PRIMARY KEY,
    DeviceID INTEGER NOT NULL,
    Metric TEXT NOT NULL,
    Value REAL NOT NULL,
    RecordedAt INTEGER NOT NULL,
    FOREIGN KEY (DeviceID)
        REFERENCES Devices(DeviceID)
);
This is flexible.
We can store:
temperature
pressure
vibration
voltage
without changing the schema.
But we’re also repeating strings millions of times.
For larger telemetry stores, we can normalize metrics too.
CREATE TABLE Metrics (
    MetricID INTEGER PRIMARY KEY,
    MetricKey TEXT NOT NULL UNIQUE,
    Unit TEXT
);
Then:
CREATE TABLE Telemetry (
    TelemetryID INTEGER PRIMARY KEY,
    DeviceID INTEGER NOT NULL,
    MetricID INTEGER NOT NULL,
    Value REAL NOT NULL,
    RecordedAt INTEGER NOT NULL,
    FOREIGN KEY (DeviceID)
        REFERENCES Devices(DeviceID),
    FOREIGN KEY (MetricID)
        REFERENCES Metrics(MetricID)
);
Now a row might effectively contain:
17 | 3 | 2.74 | 1787979615rather than repeating longer textual identifiers.
For high-volume telemetry, small rows matter.
Choosing the Right Timestamp Representation
Time is central to every telemetry query.
SQLite does not have a dedicated timestamp storage class. Dates and times can be represented using TEXT, REAL, or INTEGER values.
For high-volume sensor data, an integer timestamp is often attractive.
For example, Unix time:
1787979615Or, if greater precision is required, Unix milliseconds:
1787979615123The important thing is consistency.
If sensors report at sub-second frequency, storing only whole seconds could cause several readings to share the same timestamp.
Choose the precision your system actually needs.
UTC Makes Telemetry Easier
Devices may operate in different locations.
One sensor might be in New York.
Another might be in London.
Another might be in Tokyo.
Storing local times creates complications involving:
Time zones
Daylight saving changes
Cross-device comparisons
Centralized reporting
A simpler approach is to store telemetry timestamps in UTC.
Convert to local time only when presenting information to users.
The stored data remains consistent regardless of where the device is deployed.
Designing for Append-Heavy Writes
Most telemetry data follows this pattern:
INSERT
INSERT
INSERT
INSERT
INSERT
Old readings rarely change.
That is useful because SQLite handles append-oriented workloads efficiently when writes are structured properly.
Avoid this pattern:
Reading arrives
      ↓
INSERT
      ↓
COMMIT

Reading arrives
      ↓
INSERT
      ↓
COMMIT
If thousands of readings arrive, thousands of independent commits can become expensive.
Instead, batch them.
Batch Telemetry Inserts
Suppose 100 measurements have accumulated.
Write them inside one transaction:
BEGIN IMMEDIATE;

INSERT INTO Telemetry
(DeviceID, MetricID, Value, RecordedAt)
VALUES (17, 3, 2.74, 1787979615);

INSERT INTO Telemetry
(DeviceID, MetricID, Value, RecordedAt)
VALUES (17, 3, 2.81, 1787979620);

INSERT INTO Telemetry
(DeviceID, MetricID, Value, RecordedAt)
VALUES (17, 3, 2.86, 1787979625);

COMMIT;
In application code, you would normally prepare one parameterized INSERT statement and reuse it for every row in the batch.
That avoids repeatedly compiling the same SQL.
The basic ingestion pipeline becomes:
Sensors
   ↓
In-Memory Buffer
   ↓
Batch
   ↓
SQLite Transaction
This can dramatically improve write throughput.
How Large Should a Batch Be?
There isn’t one perfect batch size.
Larger batches usually improve throughput, but they also mean measurements remain in memory longer before becoming durable.
Imagine flushing:
Every 1 measurementDurability is immediate, but overhead is high.
Now imagine:
Every 10,000 measurementsThroughput may improve, but an unexpected process or power failure could leave a large amount of buffered data unwritten.
A practical system often combines two limits:
Flush when:
500 measurements collected

OR

2 seconds have passed
Whichever happens first triggers the write.
This gives predictable latency while still benefiting from batching.
WAL Mode for Continuous Telemetry
Telemetry ingestion often happens while other parts of the application query the database.
For example:
Sensor Collector → Writing

Dashboard        → Reading

Alert Engine     → Reading

Sync Worker      → Reading
Enable Write-Ahead Logging:
PRAGMA journal_mode = WAL;WAL allows readers and a writer to operate concurrently in many common situations.
The dashboard can inspect recent measurements while the ingestion process continues writing new batches.
Remember that SQLite still has one writer at a time.
A good IoT architecture therefore usually funnels database writes through a controlled ingestion path rather than allowing many independent components to compete for writes.
Designing the Most Important Index
One of our most common questions will be:
Show me this sensor’s measurements between these two times.
For example:
SELECT
    RecordedAt,
    Value
FROM Telemetry
WHERE DeviceID = ?
  AND MetricID = ?
  AND RecordedAt >= ?
  AND RecordedAt < ?
ORDER BY RecordedAt;
A composite index fits this query naturally:
CREATE INDEX idx_telemetry_device_metric_time
ON Telemetry(DeviceID, MetricID, RecordedAt);
SQLite can narrow the search by device and metric, then efficiently scan the required time range.
This single index may support a large portion of the application’s telemetry queries.
Don’t Index Everything
Indexes improve reads.
But every telemetry insert also needs to update every relevant index.
Suppose we create indexes on:
DeviceID
MetricID
Value
RecordedAt
DeviceID + RecordedAt
MetricID + RecordedAt
DeviceID + MetricID + RecordedAt
We’ve created substantial extra write work.
High-ingestion databases need discipline.
Start with the queries the application actually performs, then create indexes that support those access patterns.
For telemetry, fewer well-designed composite indexes are often better than many individual indexes.
Retrieving the Latest Reading
Another frequent query is:
What’s the latest temperature?
SELECT
    Value,
    RecordedAt
FROM Telemetry
WHERE DeviceID = ?
  AND MetricID = ?
ORDER BY RecordedAt DESC
LIMIT 1;
Our composite index can also help this query.
The application can use it for a dashboard such as:
Motor 17

Temperature     72.4°C
Vibration        2.81 mm/s
Voltage        231.2 V
Speed         1450 RPM
Querying a Time Window
Suppose an engineer wants the last hour of vibration data.
With millisecond Unix timestamps, the application calculates the appropriate start and end values and runs:
SELECT
    RecordedAt,
    Value
FROM Telemetry
WHERE DeviceID = ?
  AND MetricID = ?
  AND RecordedAt BETWEEN ? AND ?
ORDER BY RecordedAt;
The result can be plotted directly as a time-series graph.
For modest windows, raw telemetry works well.
For months of history, however, returning every individual measurement becomes wasteful.
That’s where aggregation becomes important.
Why Raw Telemetry Cannot Grow Forever
Consider one sensor recording every second:
60 per minute
3,600 per hour
86,400 per day
That’s over:
31 million readings per yearAnd that’s one sensor.
Ten sensors producing one measurement per second generate more than 300 million measurements per year.
Not every application produces data at this frequency, but the lesson is important:
telemetry needs a lifecycle.
Keeping every raw measurement forever is rarely the best design for an edge device.
Downsampling Old Telemetry
Recent information may need full resolution.
Historical information often does not.
For example:
Last 24 hours
Every raw reading

Last 30 days
1-minute summaries

Last year
1-hour summaries
This process is often called downsampling.
Create a summary table:
CREATE TABLE TelemetryHourly (
    DeviceID INTEGER NOT NULL,
    MetricID INTEGER NOT NULL,
    HourStart INTEGER NOT NULL,
    MinimumValue REAL NOT NULL,
    MaximumValue REAL NOT NULL,
    AverageValue REAL NOT NULL,
    SampleCount INTEGER NOT NULL,

    PRIMARY KEY (
        DeviceID,
        MetricID,
        HourStart
    )
);
Now millions of individual readings can eventually become much smaller historical summaries.
Why Store Minimum and Maximum?
Suppose temperature during one hour looked like:
Average: 4.1°CThat sounds safe.
But perhaps the actual readings included:
Minimum: 2.8°C
Maximum: 9.7°C
The average hides a potentially important temperature spike.
That’s why useful telemetry summaries commonly preserve:
Minimum
Maximum
Average
Sample count
Depending on the application, you might also preserve sums, standard deviation inputs, or other domain-specific statistics.
Building the Aggregation Query
An hourly summary might be created with:
INSERT INTO TelemetryHourly
(
    DeviceID,
    MetricID,
    HourStart,
    MinimumValue,
    MaximumValue,
    AverageValue,
    SampleCount
)
SELECT
    DeviceID,
    MetricID,
    ?,
    MIN(Value),
    MAX(Value),
    AVG(Value),
    COUNT(*)
FROM Telemetry
WHERE RecordedAt >= ?
  AND RecordedAt < ?
GROUP BY
    DeviceID,
    MetricID;
The application processes one completed time window at a time.
After confirming the summary has been created successfully, older raw data can eventually become eligible for deletion according to the retention policy.
Avoid Double-Counting Aggregation Windows
Aggregation jobs may fail and restart.
That means they should be safe to repeat.
Our summary table uses:
DeviceID + MetricID + HourStartas its primary key.
The application can use an upsert when rebuilding the same window.
For example:
INSERT INTO TelemetryHourly (...)
VALUES (...)
ON CONFLICT(DeviceID, MetricID,HourStart)
DO UPDATE SET
    MinimumValue = excluded.MinimumValue,
    MaximumValue = excluded.MaximumValue,
    AverageValue = excluded.AverageValue,
    SampleCount = excluded.SampleCount;
Now rerunning the aggregation does not create duplicate hourly records.
This makes recovery much easier.
Handling Late Sensor Data
IoT data does not always arrive in perfect timestamp order.
A sensor may temporarily lose connectivity.
Suppose the gateway receives:
10:00
10:01
10:02
10:07
Then later receives delayed readings:
10:03
10:04
10:05
10:06
If we’ve already summarized that time window, the delayed measurements could make the summary incorrect.
A production pipeline needs a policy.
Possible strategies include:
Delay aggregation until a time window is considered complete.
Recalculate recent summary windows when late data arrives.
Mark affected summaries as needing refresh.
Reject data that arrives beyond a defined lateness threshold.
The right strategy depends on how frequently late readings occur and how accurate historical summaries must be.
Preventing Duplicate Measurements
Network retries can also cause the same reading to arrive twice.
Imagine a sensor sends measurement A.
The gateway stores it, but the acknowledgement is lost.
The sensor retries.
Without duplicate protection:
A
A
both readings may be stored.
One solution is for the sensor to provide a sequence number.
ALTER TABLE Telemetry
ADD COLUMN SequenceNumber INTEGER;
Then enforce uniqueness where appropriate:
CREATE UNIQUE INDEX idx_telemetry_sensor_sequence
ON Telemetry(DeviceID, MetricID, SequenceNumber);
Now retrying the same measurement cannot silently create another copy.
This is particularly valuable when telemetry passes through unreliable networks.
What About Sensor Quality?
A number isn’t always trustworthy.
A sensor may report:
Temperature = 999.9because of a hardware fault.
Instead of simply discarding questionable measurements, some systems preserve a quality indicator.
For example:
ALTER TABLE Telemetry
ADD COLUMN Quality INTEGER NOT NULL DEFAULT 0;
The application could define:
0 = Good
1 = Suspect
2 = Invalid
Now analysts can distinguish genuine measurements from questionable sensor output without losing the original record.
Missing Data Matters Too
Suppose a temperature sensor normally reports every minute.
Then the database shows:
10:01
10:02
10:03
10:14
There may be nothing wrong with the values themselves.
The problem is the 11-minute gap.
Telemetry systems therefore need to reason about both:
What data exists?and:
What data should have existed?The device metadata can store the expected reporting interval.
Monitoring logic can then detect missing measurements and raise a device-health warning.
Designing Retention Tiers
A useful retention policy might be:
DataRetentionRaw telemetry7 daysMinute summaries30 daysHourly summaries1 yearDaily summariesSeveral years
The exact numbers depend on:
Storage capacity
Regulatory requirements
Troubleshooting needs
Sensor frequency
Business requirements
The important part is deciding deliberately.
Don’t wait until the device runs out of disk space.
Deleting Old Raw Telemetry
Once data has been successfully summarized and, where required, synchronized elsewhere, old rows can be removed.
DELETE FROM Telemetry
WHERE RecordedAt < ?;
For a large database, deleting a huge amount of history in one transaction may be disruptive.
A better maintenance process can delete smaller ranges periodically.
For example:
Delete 10,000 rows
Commit
Pause
Continue
This keeps maintenance work from monopolizing the database for long periods.
Deletion Does Not Automatically Shrink the File
Deleting old rows frees pages inside the SQLite database.
SQLite can reuse those pages later.
The operating-system file, however, may not immediately become smaller.
That is normal.
For telemetry systems that continuously delete old records and insert new ones, reusing freed space can be exactly what we want.
If actual file-size reduction is necessary, options such as VACUUM or an appropriate auto-vacuum strategy need to be planned carefully around the workload.
Constantly rebuilding an active telemetry database merely to make its file smaller is usually unnecessary.
Monitoring the WAL File
With continuous writes and WAL mode enabled, the WAL file also deserves attention.
SQLite checkpoints committed WAL content back into the main database.
Normally this happens automatically.
However, long-running readers can delay checkpoint progress and allow the WAL file to grow.
On an IoT device with limited storage, that’s important.
Monitor:
Main database size
WAL size
Free disk space
Checkpoint behaviour
A dashboard query that accidentally keeps a read transaction open for hours can become a storage problem.
Keep read transactions short.
Local Analytics Without the Cloud
Once telemetry is stored efficiently, SQLite can answer useful questions directly on the device.
For example, average vibration over the last hour:
SELECT AVG(Value)
FROM Telemetry
WHERE DeviceID = ?
  AND MetricID = ?
  AND RecordedAt >= ?;
Or detect unusually high readings:
SELECT
    RecordedAt,
    Value
FROM Telemetry
WHERE DeviceID = ?
  AND MetricID = ?
  AND Value > ?
ORDER BY RecordedAt DESC;
The edge application can use these results for:
Dashboards
Alerts
Maintenance decisions
Trend detection
Local automation
No cloud round trip is required.
Preparing Telemetry for Synchronization
Many IoT systems eventually upload measurements to a central platform.
Rather than repeatedly searching for unsent rows using complicated logic, we can track synchronization state.
One approach is:
ALTER TABLE Telemetry
ADD COLUMN Synced INTEGER NOT NULL DEFAULT 0;
Then:
SELECT *
FROM Telemetry
WHERE Synced = 0
ORDER BY TelemetryID
LIMIT 1000;
After successful server acknowledgement, those rows can be marked as synchronized.
For very high ingestion rates, synchronization bookkeeping may be better handled using a separate queue or a high-water-mark strategy rather than adding another mutable field and index to every telemetry row.
The correct design depends on the workload.
Think About Write Amplification
Every incoming measurement may cause more storage work than the single telemetry row suggests.
Consider:
Telemetry row
+
Primary key
+
Time-series index
+
Synchronization index
+
Additional indexes
One logical insert may update several B-trees.
On flash-based edge storage, unnecessary writes can affect both performance and device longevity.
This is another reason to keep telemetry schemas and indexes deliberately lean.
A Production Telemetry Pipeline
Putting everything together, our system now looks like:
Sensors
   ↓
Validation
   ↓
Sequence / Duplicate Check
   ↓
In-Memory Buffer
   ↓
Batch Transaction
   ↓
SQLite Raw Telemetry
   ↓
   ├── Recent Queries
   ├── Local Alerts
   ├── Dashboard
   ├── Cloud Sync
   └── Aggregation
          ↓
     Summary Tables
          ↓
     Retention Worker
          ↓
     Old Raw Data Removed
Every component has a clear responsibility.
The ingestion path remains short and fast.
Expensive work happens later.
That separation is important.
The sensor collector’s first responsibility should be to capture the measurement reliably, not generate reports, synchronize with the cloud, clean old records, and calculate historical statistics before accepting the next reading.
When SQLite Fits IoT Telemetry Well
SQLite is particularly well suited when:
Data belongs primarily to one device or gateway.
Measurements need local durability.
Connectivity may be unreliable.
Local queries are important.
Deployment must remain simple.
Write concurrency can be controlled.
Data volume fits the device’s storage and processing capabilities.
Typical examples include:
Industrial gateways
Smart buildings
Agricultural sensors
Vehicle systems
Environmental monitoring
Retail equipment
Energy meters
Laboratory instruments
Home automation hubs
In these systems, SQLite can provide substantial time-series capability without requiring a separate database server.
When to Use Something Larger
SQLite on the edge and a large central time-series platform are not competing ideas.
They often belong in the same architecture.
For example:
Sensor
   ↓
SQLite Edge Gateway
   ↓
Internet
   ↓
Central Ingestion Platform
   ↓
Time-Series / Analytics Database
SQLite handles:
Local durability
Offline operation
Recent analysis
Buffering
Device-level reporting
The central platform handles:
Fleet-wide analysis
Long-term storage
Cross-device queries
Massive-scale reporting
Each database is solving the problem at the scale where it works best.
Best Practices
When storing IoT telemetry streams with SQLite:
Keep telemetry rows compact.
Store device and metric metadata separately when volume justifies it.
Use a consistent UTC timestamp representation.
Choose timestamp precision deliberately.
Batch inserts inside transactions.
Reuse prepared statements.
Consider WAL for concurrent local reads.
Keep database write ownership controlled.
Design indexes around real time-range queries.
Avoid unnecessary indexes.
Detect duplicate measurements.
Plan for late-arriving data.
Preserve sensor quality information when useful.
Detect gaps as well as abnormal values.
Downsample older telemetry.
Define retention tiers before storage becomes a problem.
Delete old records in manageable batches.
Monitor database, WAL, and disk usage.
Keep long-running read transactions out of the ingestion path.
Design synchronization so retries are safe.
Closing Thoughts
IoT telemetry looks simple when we consider a single sensor reading.
A temperature, a timestamp, a device identifier.
But once sensors run continuously for months or years, those tiny measurements become a serious data-management workload.
The key is not simply making SQLite accept more rows.
It is designing the entire lifecycle of those rows.
Measurements need to arrive quickly, survive interruptions, remain easy to query, support local decisions, become smaller as they age, synchronize safely when necessary, and eventually leave the device when they are no longer useful.
SQLite gives us the tools to build that lifecycle inside a remarkably small footprint.
With compact time-series schemas, efficient transactions, carefully chosen indexes, WAL-based concurrency, downsampling, retention policies, and reliable synchronization, an IoT gateway can store and analyze substantial telemetry streams without depending on a database server.
The sensor keeps measuring.
SQLite keeps the history.
And the application turns that history into something useful.
Subscribe Now
Build Smarter IoT Systems with SQLite
SQLite can do far more than simply collect sensor readings. With the right architecture, it can provide fast local ingestion, time-series analysis, offline durability, aggregation, and reliable synchronization directly at the edge.
Subscribe to SQLite Forum for practical tutorials, advanced SQLite techniques, and real-world architectures covering IoT, edge computing, synchronization, analytics, performance, and production-ready system design.
Subscribe and keep discovering what you can build with SQLite.